
Hi Folks,
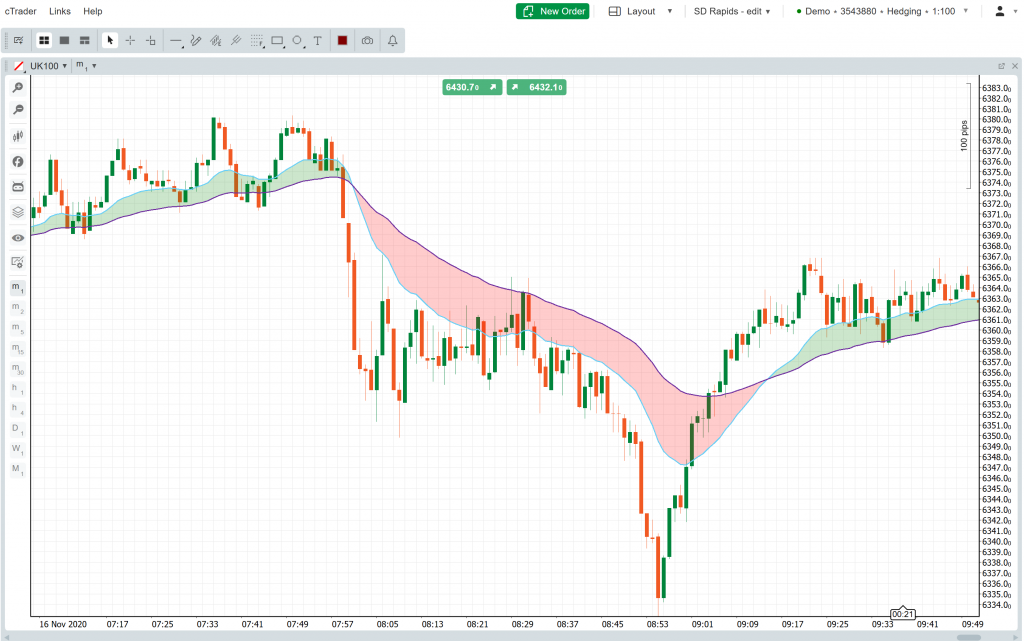
Today I’ve uploaded a new ctrader indicator on to our Teams site. This will colour code the region between two exponential moving averages so you can see if they are stacked in BUY or SELL mode. The parameters allow you to specify the period used for each of the EMA’s. The example above shows a 21 EMA and a 55EMA on an M1 FTSE chart. I hope you find it useful !
For copies of this and your other BOT’s and Indicators then please subscribe
New EMA Cloud Indicator